Decision-support prototype · model v1.6.0 · 26 October 2026
An exploratory model of household gas exit in Canberra
The Canberra Energy Policy Lab simulates how 10,000 gas-connected homes respond, year by year from 2026 to 2045, to electrification support, delivery capacity, finance, gas network cost recovery and social factors. It is built to make the links between those mechanisms explicit, testable and open to challenge.
Read this first. Outputs are synthetic and illustrative. They are not forecasts for the ACT and not estimates of the causal effect of any policy. Several key parameters, including the household choice coefficients, have not been estimated from ACT data.
What the model is for
The ACT has committed to net zero emissions by 2045, and fossil gas accounted for 17.8% of territory emissions in 2024-25 (ACT Government, 2026a, 2026b). About 127,000 homes remain active residential gas customers (ACT Government, 2026d). How quickly they leave gas, at what public cost, and with what consequences for the households that remain, depends on decisions that interact. Households decide whether to electrify. Installers and public programs decide what can be delivered and financed. The gas and electricity networks respond to fewer customers and to higher peak demand.
Instruments that look effective on their own can be limited by a constraint elsewhere in the system (Meadows, 2008; Sterman, 2000). The model is designed to show where that happens, and why.
- Make the causal structure linking household choice, delivery, finance and networks explicit and testable.
- Explore how policy instruments interact, including their timing and sequence, under stated assumptions.
- Show which constraint binds each year: household demand, installer capacity or the budget.
- Report distributional outcomes: lower-income households and homes left on gas.
- Confront the model with observed data and record where it fails.
How it works
Ten thousand initially gas-connected homes are divided into six groups: higher-, middle- and lower-income owners, private and lower-income renters, and apartment owners. The model is deterministic and annual. Each engine version reproduces every earlier version exactly, so any change in results can be traced to a documented change in the model.
flowchart TB
    subgraph IN["Inputs"]
        P["Policy timetable<br/>grants, loans, rules,<br/>budget, advice"]
        C["Context settings<br/>prices, package cost, capacity,<br/>financial response"]
    end
    subgraph ENG["Simulation engine: 10,000 homes, annual, 2026 to 2045"]
        O["Social dynamics<br/>word of mouth, trust,<br/>support, hardship"]
        H["Household choice<br/>six cohorts, logistic rule"]
        S["Delivery<br/>installer capacity,<br/>budget, queue"]
        F["Finance<br/>grants, loans,<br/>terms at approval"]
        G["Gas network<br/>connection states,<br/>fixed charge"]
        E["Electricity network<br/>cold-day peak,<br/>investment, tariff"]
    end
    subgraph OUT["Outputs by year and cohort"]
        R1["Gas exits<br/>and queues"]
        R2["Public cost and<br/>household energy burden"]
        R3["Network peak<br/>and gas charges"]
        R4["Emissions and the<br/>lower-income gap"]
    end
    C ~~~ O
    P --> H
    C --> H
    O --> H
    H --> S --> F --> G
    S --> E
    S --> R1
    F --> R2
    G --> R3
    E --> R3
    G --> R4
    R1 --> V["Backcasts against public data<br/>AER, Evoenergy, CIE, ABS, ACT,<br/>2021-22 to 2025-26"]
The annual cycle
Each year, 12% of homes still on gas face a replacement opportunity, such as an appliance failure, a renovation or a sale. Each cohort's requests depend on a logistic choice value, following the form of a binary logit model (Train, 2009). Requests then pass through installer capacity and the public budget before homes leave gas.
flowchart TD
    A["1. Resolve the year's settings<br/>policy timetable, prices, capacity growth"] --> B["2. Update what households see<br/>homes off gas, word of mouth, trust, support for rules"]
    B --> C["3. Build each cohort's offer<br/>grant, loan terms, cash outlay"]
    C --> D["4. Household requests<br/>opportunity x rule or logistic choice x access"]
    D --> E["5. Queue and allocation<br/>installer capacity, then the annual budget"]
    E --> F["6. Approvals on this year's terms<br/>a share installed the following year"]
    F --> G["7. Gas exits and connection states<br/>dormant, closed, abolished"]
    G --> H["8. Gas fixed charge<br/>spread over paying connections"]
    G --> I["9. Electricity demand and network<br/>cold-day peak; investment two years after a need"]
    H --> J["10. Record the year<br/>exits, costs, burden, emissions, hardship"]
    I --> J
    J -->|"next year"| A
Gas connections and cost recovery
Not every exit ends a gas connection. Following AER disconnection reporting (Australian Energy Regulator, 2026b), 37% of exits close the account. The rest stay connected and keep paying the fixed charge until they are abolished, at 4.2% a year. Fixed network costs not retired as customers leave are spread over the paying connections, so the charge on remaining homes rises.
flowchart TB
    G["Homes on gas"] -->|"requests"| Q["Waiting for installation"]
    Q -->|"approved"| A{"Approval year"}
    A -->|"85% installed that year"| X["Gas exit completed"]
    A -->|"15% installed next year"| P["Approved, not yet installed"]
    P --> X
    X -->|"37% close the account"| CL["Account closed:<br/>no longer paying"]
    X -->|"63% stay connected"| DR["Dormant and paying,<br/>12 months or less"]
    DR -->|"after a year"| DL["Dormant and paying,<br/>over 12 months"]
    DL -->|"4.2% a year"| AB["Connection abolished"]
Social factors and versions
Optional mechanisms represent word of mouth with a delay, trust in the schemes, public support for gas appliance rules, hardship among homes left on gas, and the visible stock of all-electric homes (Bass, 1969; Rogers, 2003). Their design follows reviews of social factors in energy models (Krumm et al., 2022). Each is tested against observed data before any result is used, as Fisch-Romito et al. (2025) recommend.
flowchart TB
    subgraph ROW1["Structure, policy and timing"]
        direction LR
        V10["v1.0.0<br/>original prototype"] --> V11["v1.1.0<br/>policy timetable,<br/>current ACT policy,<br/>2026 energy calibration"]
        V11 --> V12["v1.2.0<br/>gas connection states,<br/>direct AER backcast"]
        V12 --> V13["v1.3.0<br/>terms fixed at approval,<br/>installation lag"]
    end
    subgraph ROW2["Behaviour and social factors"]
        direction LR
        V14["v1.4.0<br/>anticipation of<br/>announced changes"] --> V15["v1.5.0<br/>social dynamics:<br/>word of mouth, trust, support"]
        V15 --> V16["v1.6.0<br/>all-electric homes<br/>outside the model"]
    end
    ROW1 -->|"v1.3.0 to v1.4.0"| ROW2
Findings to date
These are synthetic model results under stated assumptions, unless labelled as observed. Hover over a mark to read its value, or open the data table beneath each figure.
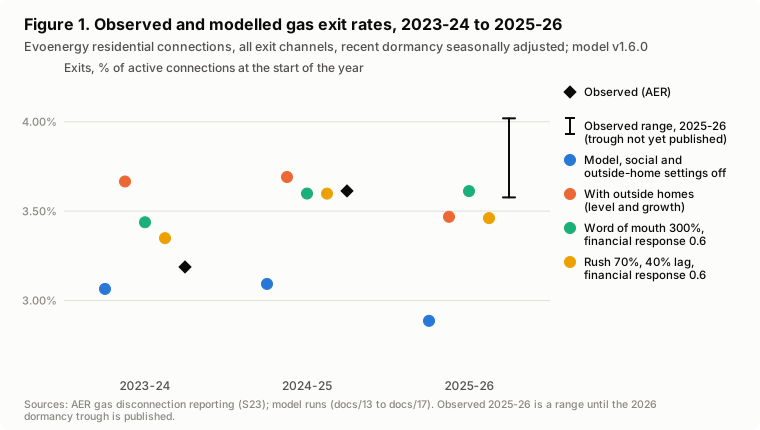
Reading. Observed exits were 3.19% of active connections in 2023-24 and 3.61% in 2024-25, and lie between 3.58% and 4.02% in 2025-26. The model with its default settings is close in 2023-24 but misses the step in 2024-25. Mechanisms that raise later years each overshoot 2023-24. No single smooth mechanism reproduces the step, so monthly scheme approval data are needed to test it.
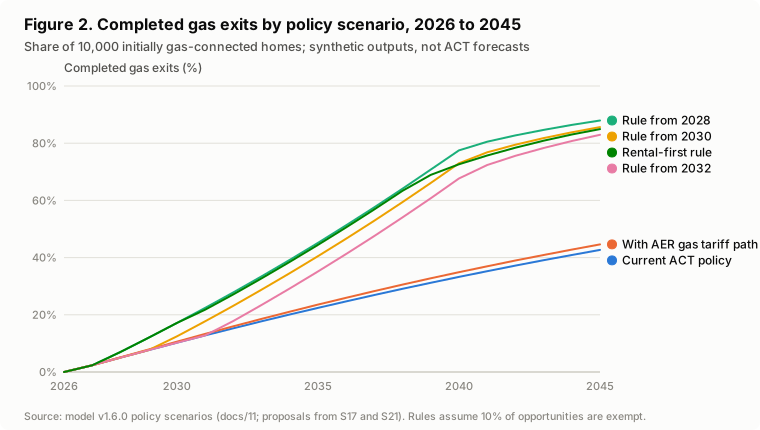
Reading. Under current ACT policy, 42.7% of the homes have left gas by 2045. Gas appliance rules raise this to between 82.9% and 87.9%, depending on the start year. A rule from 2028 makes installer capacity the binding constraint for about 12 years, which makes workforce planning a precondition for regulation.
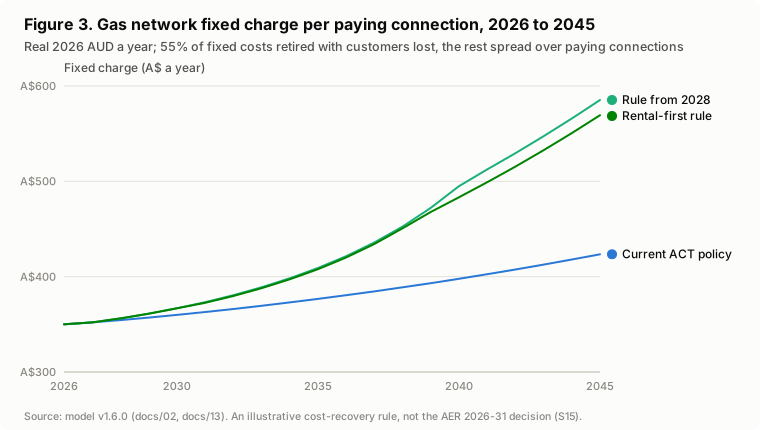
Reading. Under the illustrative cost-recovery rule, the fixed charge rises from A$350 to A$423 a year by 2045 under current policy, and to A$585 with a 2028 rule. The households left paying it are the policy concern.
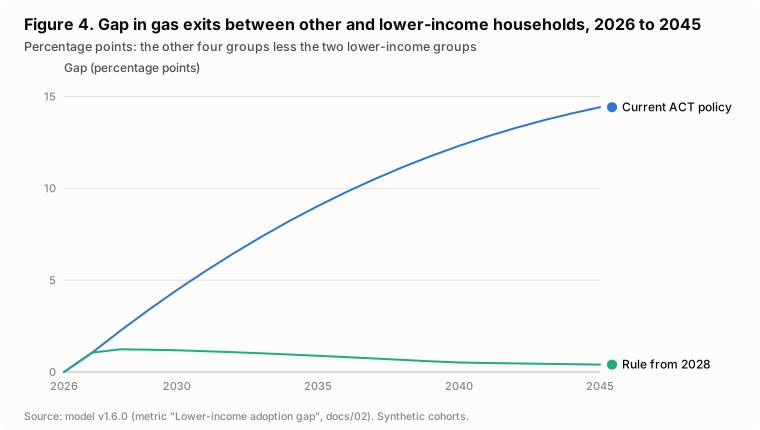
Reading. Under current policy, lower-income households fall about 14 percentage points behind other households by 2045. A rule that covers all opportunities nearly closes the gap, because it does not depend on voluntary choice.
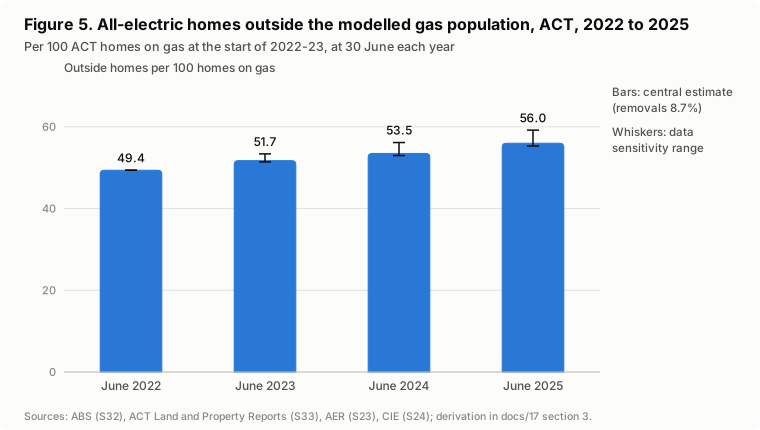
Reading. Public ABS and ACT data imply about 49 all-electric homes outside the modelled gas population for every 100 homes on gas in June 2022, rising to 56 by June 2025. They raise the level of word of mouth but grow too smoothly to explain the 2024-25 step, and their level cannot be separated from the uncalibrated choice constant.
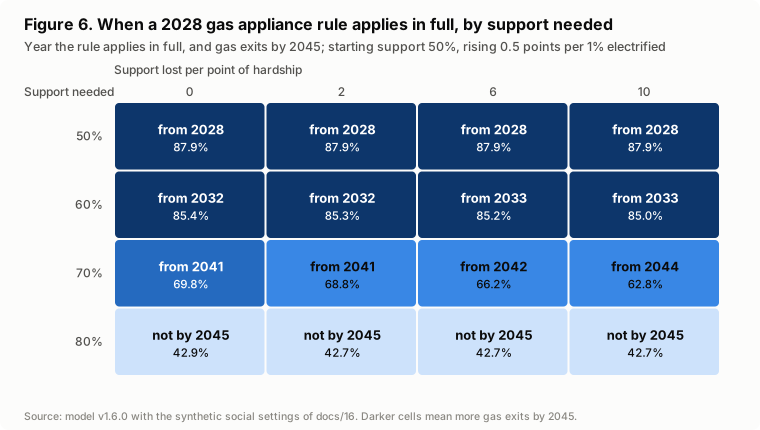
Reading. If a rule applies only when public support exceeds a threshold, the pace of electrification decides when it takes effect. Hardship among homes left on gas slows support but, in these synthetic settings, does not stop the rule. This is a hypothesis for consultation and survey evidence to test.
Use the model
In the browser
- Open the simulator and choose a starting package or a policy scenario.
- Adjust policy, delivery and context settings, or schedule changes in the policy timetable.
- Read pathways, the binding constraint and the comparison with current policy.
- Explore parameter interactions and sensitivity, then export the scenario, data or a briefing.
On your computer
Node.js 20 or later; no packages to install.
node scripts/serve.mjs
npm testFrom the command line
node scripts/run_backcast_direct.mjs --engine 1.6.0
node scripts/report_v1_6.mjs
npm run figuresDocumentation
Every document is available in the documentation viewer, diagrams included.
| Document | Contents |
|---|---|
| Introduction | Purpose, method, evidence, verification, findings, limitations and references |
| User guide | How to use the simulator and the command line |
| Mathematical specification | Equations and timing |
| Direct backcast | Connection states and the comparison with AER data |
| Social-systems map | Stakeholders, boundary, feedback loops and social mechanisms |
| Visible all-electric homes | ACT dwelling data and the backcast rerun |
| Limitations | Known limitations and review findings |
| Source register | Every policy and data source, with evidence status and research date |
| Validation record | Tests, mutation checks, independent reviews and releases |
Key references
- ACT Government. (2026a). ACT Climate Change Strategy 2026-2036. https://www.climatechoices.act.gov.au/policy-programs/act-climate-change-strategy
- ACT Government. (2026b). ACT Climate Change Strategy 2026-36: Overarching framework. climatechoices.act.gov.au
- ACT Government. (2026d). Developing future gas appliance regulations for the ACT (summary). climatechoices.act.gov.au
- Australian Energy Regulator. (2026b). Gas quarterly disconnection reporting, 7 August 2026 [Data set]. aer.gov.au
- Bass, F. M. (1969). A new product growth for model consumer durables. Management Science, 15(5), 215-227. https://doi.org/10.1287/mnsc.15.5.215
- Fisch-Romito, V., Jaxa-Rozen, M., Wen, X., & Trutnevyte, E. (2025). Multi-country evidence on societal factors to include in energy transition modelling. Nature Energy, 10, 460-469. https://doi.org/10.1038/s41560-025-01719-7
- Krumm, A., Süsser, D., & Blechinger, P. (2022). Modelling social aspects of the energy transition: What is the current representation of social factors in energy models? Energy, 239, 121706. https://doi.org/10.1016/j.energy.2021.121706
- Meadows, D. H. (2008). Thinking in systems: A primer (D. Wright, Ed.). Chelsea Green.
- Rogers, E. M. (2003). Diffusion of innovations (5th ed.). Free Press.
- Sterman, J. D. (2000). Business dynamics: Systems thinking and modeling for a complex world. Irwin/McGraw-Hill.
- Train, K. E. (2009). Discrete choice methods with simulation (2nd ed.). Cambridge University Press.